Google Analytics and social media analytics: how I started loving these numbers as a Content Marketer
It’s that time of the month again: the moment to look back at the content analytics of last month. My social media analytics are looking good, and so is the performance of my website, according to Google Analytics. But how do I prove that my social media efforts are paying off and contributing to our overall marketing numbers? This usually comes down to an endless collection of numbers and combining them in one overview. Until I start feeling a bit dizzy, looking at massive spreadsheets that make no sense. That’s why I said to myself there should be a better way. An easier solution. And there is! Read along to discover the newest integration that helped me out.

This probably sounds familiar to you: multiple open tabs with different social media platforms and website performance statistics, a lot of copying and pasting to get all the numbers in one place. A very time-consuming, and above all error-prone, process.
For years, I have struggled with proving the cohesion between my well-performing social media campaigns and a constant stream of website conversions. Tying everything together: that was my biggest issue. I needed a clear overview, which helps me to prove the attribution of social media to conversions that lead to sales. And the fact that brand awareness isn’t just something we do for fun, as marketers.
It would make my job as Content Marketer so much easier. And way more interesting, as well. It would help me to focus on what makes it challenging and interesting for me. In the end, creating new content based on successful campaigns is what drives me!
The solution: complete integration of all statistics in one dashboard
Thanks to the possibility to connect Google Analytics accounts and all business social media accounts within Coosto, you easily combine all relevant metrics in one overview. The dashboard templates are the perfect way to display the metrics that are important for your business goals. By doing so, you gain insights on the performance of your social media posts, platforms and campaigns, in relation to your Google Analytics stats, such as conversions and page views.
To prove how easy it is to answer important questions about social media and content performance with the customizable dashboards, I have a few examples. Because in the end, actions speak louder than words!
Cases: how you prove the success of social media & content
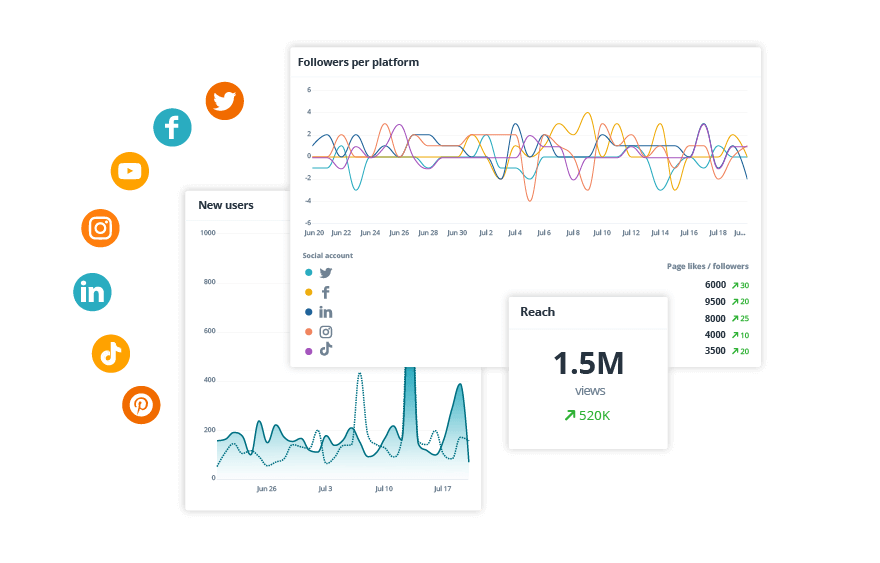
The effect of social media campaigns on website visitors and conversions
The first example proves the connection between website visitors and social media campaigns. How many (new) visitors reached your website thanks to a successful social media campaign? And how many conversions did I get out of this post?
To answer these questions, I had to manually combine all my website statistics and social media data. Google Analytics in Coosto enables me to put these numbers easily together. Check the performance of social posts from a specific campaign and compare these directly to the number of (new) users and conversions on your website, derivative from this campaign.
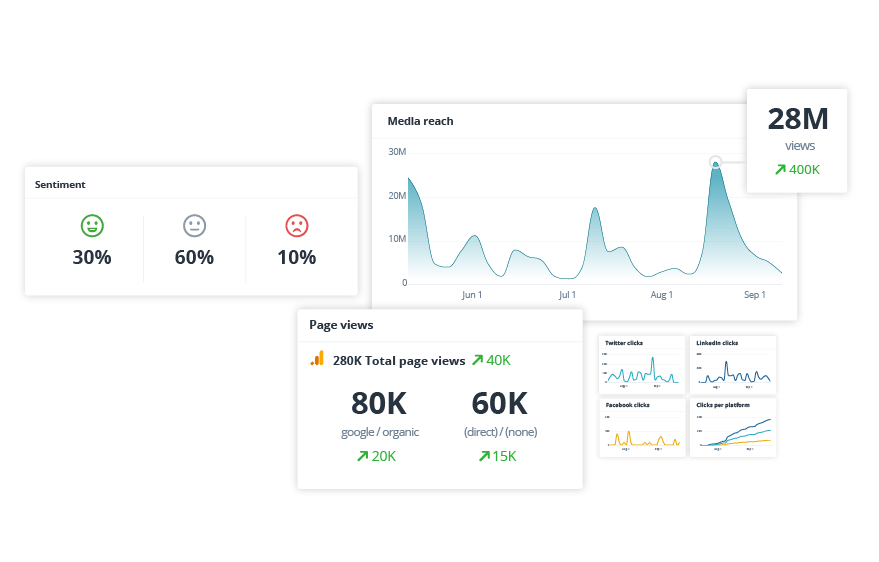
The effect of brand awareness on cost-free web traffic
The second example is focused on the positive effects of a well-known brand name and media reach. Because how do your daily results benefit from a strong brand name? Often, the power of brand awareness is underestimated and for a long time, it has been difficult to prove the (long-term) effects of it. Time to say goodbye to this.
By comparing the total reach of your brand in all online media sources, and putting this next to the direct traffic stats on your website, you will quickly realize the peaks in these numbers match. In other words, all the efforts from the past and today to create a stronger brand are paying off! No advertisement costs are involved (anymore): these valuable website visitors know what they are looking for and therefore a very likely to convert to paying customers. All thanks to a strong brand name, and a high media reach.
To even analyze this a bit deeper, you can add the sentiment around your brand. To what extent is your brand mentioned positively or negatively? And can you relate this to peaks in website traffic? The customizable dashboards make it easier than ever to answer these questions.
Discover how Google Analytics and social media numbers make your job more fun!
So, are you ready to start making the numbers speak for themselves? I dare to say, I’m starting to even enjoy putting all the numbers related to social media and website performance together. And the possibilities are endless! Combining the statistics from these platforms offers countless valuable new insights.
Like I said, running my monthly analysing is no longer a task I want to postpone. Who would have thought I would ever be the one saying this? I didn’t, that’s for sure. Nowadays, I surprise myself by wanting to look for new insights and enjoy combining interesting and relevant statistics. Think of the number of sales we make thanks to my social media posts, the relation between social media reach and the (growing) number of website visitors, and the contribution social media engagement to conversions on landing pages.
Do you want to experience for yourself how this improved way of approaching content analytics can take your strategy to the next level? Try it for yourself! During our free trial, you get to experience the benefits of the integration.